Generate Alpha Diversity Boxplot (Single Time Point)
Source:R/generate_alpha_boxplot_single.R
generate_alpha_boxplot_single.RdGenerates boxplots of alpha diversity indices for cross-sectional analysis or a single time point, with optional grouping and stratification.
Usage
generate_alpha_boxplot_single(
  data.obj,
  alpha.obj = NULL,
  alpha.name = c("shannon", "observed_species"),
  depth = NULL,
  time.var = NULL,
  t.level = NULL,
  group.var = NULL,
  strata.var = NULL,
  adj.vars = NULL,
  base.size = 16,
  theme.choice = "bw",
  custom.theme = NULL,
  palette = NULL,
  pdf = TRUE,
  file.ann = NULL,
  pdf.wid = 11,
  pdf.hei = 8.5,
  ...
)
Arguments
- data.obj
A MicrobiomeStat data object, which is a list containing at minimum the following components:
feature.tab: A matrix of feature abundances (taxa/genes as rows, samples as columns)meta.dat: A data frame of sample metadata (samples as rows)
Optional components include:
feature.ann: A matrix/data frame of feature annotations (e.g., taxonomy)tree: A phylogenetic tree object (class "phylo")feature.agg.list: Pre-aggregated feature tables by taxonomy
Data objects can be created using converters like
mStat_convert_phyloseq_to_data_objor importers likemStat_import_qiime2_as_data_obj.- alpha.obj
A list containing pre-calculated alpha diversity indices. If NULL and alpha diversity is needed, it will be calculated automatically. Names should match the alpha.name parameter (e.g., "shannon", "simpson"). See
mStat_calculate_alpha_diversity.- alpha.name
Character vector specifying which alpha diversity indices to analyze. Options include:
"shannon": Shannon diversity index
"simpson": Simpson diversity index
"observed_species": Observed species richness
"chao1": Chao1 richness estimator
"ace": ACE richness estimator
"pielou": Pielou's evenness
- depth
Numeric value or NULL. Rarefaction depth for diversity calculations. If NULL, uses minimum sample depth or no rarefaction.
- time.var
Character string specifying the column name in meta.dat containing the time variable. Required for longitudinal and paired analyses. Should be a factor or character with meaningful time point labels.
- t.level
Character string specifying the time level/value to subset data to, if a time variable is provided. Default NULL does not subset data.
- group.var
Character string specifying the column name in meta.dat containing the grouping variable (e.g., treatment, condition, phenotype). Used for between-group comparisons.
- strata.var
Character string specifying the column name in meta.dat for stratification. When provided, analyses and visualizations will be performed separately within each stratum (e.g., by site, batch, or sex).
- adj.vars
Character vector specifying column names in meta.dat to be used as covariates for adjustment in statistical models. These variables will be included as fixed effects.
- base.size
Numeric value specifying the base font size for plot text elements. Default is typically 16.
- theme.choice
Character string specifying the ggplot2 theme to use. Options include:
"bw": Black and white theme (theme_bw)
"classic": Classic theme (theme_classic)
"minimal": Minimal theme (theme_minimal)
"prism": GraphPad Prism-like theme
"nature": Nature journal style
"light": Light theme (theme_light)
Can also use a custom ggplot2 theme object via custom.theme.
- custom.theme
A custom ggplot2 theme object to override theme.choice. Should be created using ggplot2::theme() or a complete theme function.
- palette
Character vector of colors or a named palette for the plot. If NULL, uses default MicrobiomeStat color scheme. Can be:
A vector of color codes (e.g., c("#E41A1C", "#377EB8"))
A palette name recognized by the plotting function
Logical. If TRUE, saves the plot(s) to PDF file(s) in the current working directory. Default is TRUE.
- file.ann
Character string for additional annotation to append to output filenames. Useful for distinguishing multiple outputs.
- pdf.wid
Numeric value specifying the width of PDF output in inches. Default is typically 11.
- pdf.hei
Numeric value specifying the height of PDF output in inches. Default is typically 8.5.
- ...
Additional arguments passed to underlying functions.
Value
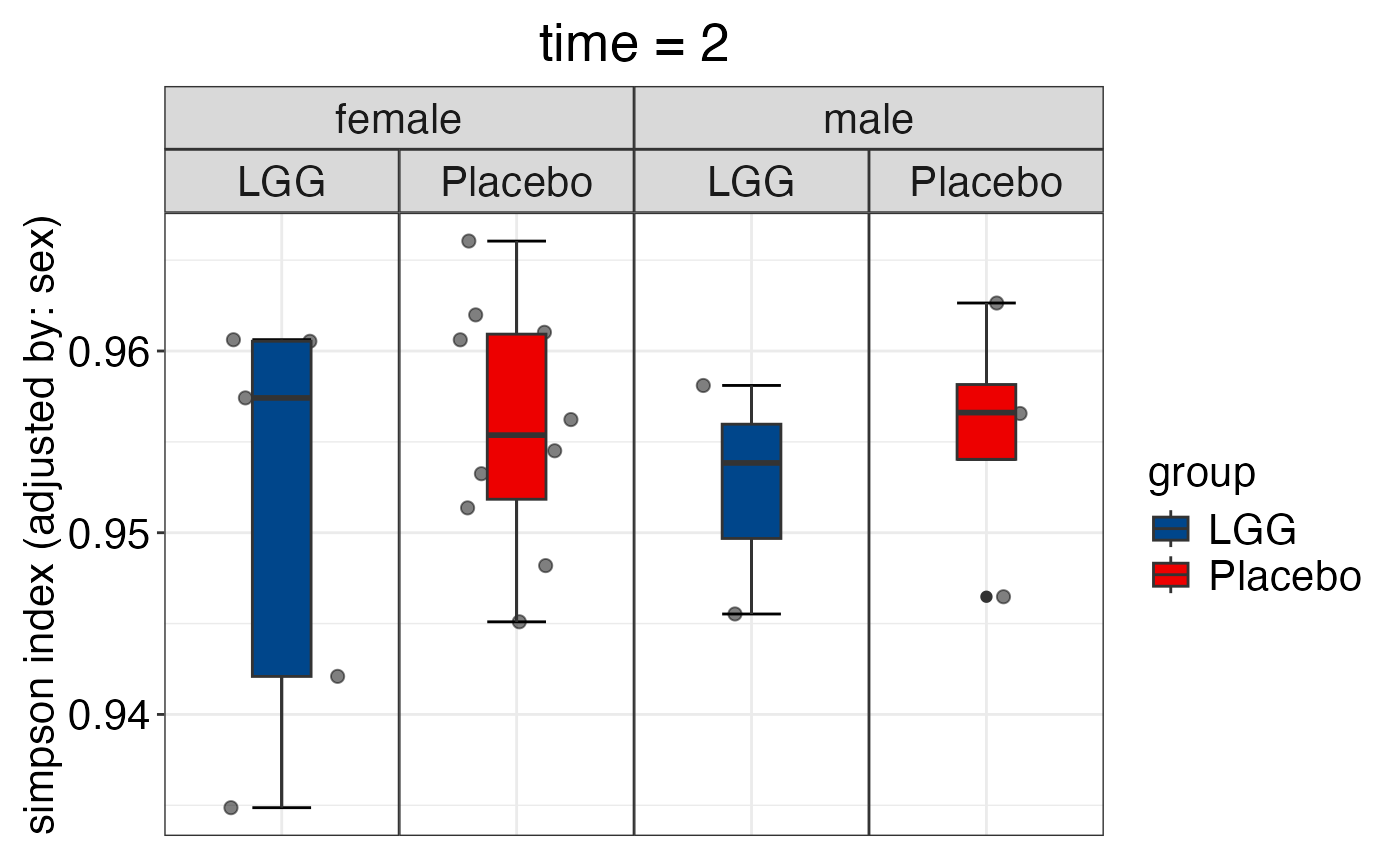
A list of boxplots displaying the specified alpha diversity indices at the specified time point dplyr::across different groupings, stratified by the specified stratification variable (if provided). Each boxplot in the list corresponds to one of the alpha diversity indices specified in `alpha.name`. The boxplots will be saved as PDF files if `pdf` is set to `TRUE`.
Examples
if (FALSE) { # \dontrun{
library(vegan)
library(ggh4x)

# Load data
data(peerj32.obj)

# First example with peerj32.obj
generate_alpha_boxplot_single(
  data.obj     = peerj32.obj,
  alpha.obj    = NULL,
  alpha.name   = c("simpson"),
  time.var     = "time",
  t.level      = "2",
  group.var    = "group",
  strata.var   = "sex",
  adj.vars     = "sex",
  base.size    = 16,
  theme.choice = "bw",
  palette      = NULL,
  pdf          = TRUE,
  file.ann     = NULL,
  pdf.wid      = 11,
  pdf.hei      = 8.5
)

alpha.obj <- mStat_calculate_alpha_diversity(peerj32.obj$feature.tab, "simpson")
generate_alpha_boxplot_single(
  data.obj     = peerj32.obj,
  alpha.obj    = alpha.obj,
  alpha.name   = c("simpson"),
  time.var     = "time",
  t.level      = "2",
  group.var    = "group",
  strata.var   = "sex",
  adj.vars     = "sex",
  base.size    = 16,
  theme.choice = "bw",
  palette      = NULL,
  pdf          = TRUE,
  file.ann     = NULL,
  pdf.wid      = 11,
  pdf.hei      = 8.5
)

# Load another dataset
data("subset_T2D.obj")

# Second example with subset_T2D.obj
generate_alpha_boxplot_single(
  data.obj     = subset_T2D.obj,
  alpha.obj    = NULL,
  alpha.name   = c("shannon"),
  time.var     = "visit_number",
  t.level      = "   3",
  group.var    = "subject_race",
  strata.var   = "subject_gender",
  adj.vars     = "sample_body_site",
  base.size    = 16,
  theme.choice = "bw",
  palette      = NULL,
  pdf          = TRUE,
  file.ann     = NULL,
  pdf.wid      = 20,
  pdf.hei      = 8.5
)

} # }
library(vegan)
#> Loading required package: permute
library(ggh4x)
#> Loading required package: ggplot2

# Load data
data(peerj32.obj)

# First example with peerj32.obj
generate_alpha_boxplot_single(
  data.obj     = peerj32.obj,
  alpha.obj    = NULL,
  alpha.name   = c("simpson"),
  time.var     = "time",
  t.level      = "2",
  group.var    = "group",
  strata.var   = "sex",
  adj.vars     = "sex",
  base.size    = 16,
  theme.choice = "bw",
  palette      = "lancet",
  pdf          = FALSE,
  file.ann     = NULL,
  pdf.wid      = 11,
  pdf.hei      = 8.5
)
#> Data has been subsetted based on the provided condition.
#> Updated metadata to match the subsetted data.
#> The following samples were excluded: sample-1, sample-3, sample-5, sample-7, sample-9, sample-11, sample-13, sample-15, sample-17, sample-19, sample-21, sample-23, sample-25, sample-27, sample-29, sample-31, sample-33, sample-35, sample-37, sample-39, sample-41, sample-43
#> Updated feature table to match the subsetted data.
#> Updated feature annotation to match the subsetted data.
#> Data subsetting complete. Returning updated data object.
#> Warning: It appears the data may not have been rarefied. Please verify.
#> Calculating simpson diversity...
#> Diversity calculations complete.
#> Alpha diversity has been adjusted for the following covariates: sex.
#> $simpson

#>
#>